Browse All Articles


Q1 2026 State of Spend: The controlled consumer
The Controlled Consumer:
Why UK shoppers entered 2026 already spending with intent
The New Year value hunt started before Christmas.
Cardlytics’ State of Spend analysis of Q4 2025 and early Q1 2026 shows that UK consumers did not loosen their spending habits over the festive period. Instead, they became more deliberate about how and where they spent. Drawing on card-based transaction data from over 23 million bank accounts, the analysis points to a shift toward a more controlled approach to spending that is now shaping behaviour into 2026.
The last State of Spend showed that UK consumers had returned to the market, but with conditions. Spending resumed, but cautiously. Shoppers scrutinised price, convenience and perceived quality, pulling back when expectations were not met. Consumers would still spend, but largely when prompted by the right offer or moment.
The latest data shows that this scrutiny has since become embedded in shoppers’ habits. December revealed how consumers were already operating under tighter decision-making rules as they approached the new year.

With inflation ticking up again at the end of the year, cost pressures remained firmly in place. Rather than retreating from spending altogether, consumers adapted — switching formats, trading down and filtering purchases more aggressively. Festive spending held, but it was more controlled, with loyalty weakening and defaults increasingly questioned. As a result, consumers entered Q1 already spending more selectively.
Read the full report by downloading it here.

The Golden Quarter is Changing: Inside the 2025 State of Spend
The Golden Quarter is Changing: Inside the 2025 State of Spend
The UK’s peak retail season is evolving. Consumers are still spending, but they’re more selective, strategic, and values-driven than ever before. Based on spend data from over 23 million UK bank accounts and nationally representative research, Cardlytics' State of Spend report uncovers what’s shaping the 2025 Golden Quarter — and where brands should focus to win.
Headline Trend Summaries (With Light Stats)
1. Black Friday is no longer the main event
The era of single-day shopping spikes is fading. Our data reveals that consumers are spreading spend across weekends and early December instead. Brands focused only on the Friday are missing the bigger picture.
2. Gifts that matter and don’t just impress
Over half of consumers say they’re choosing meaningful or practical gifts this year. Beauty and books are holding strong, while luxury and electrical categories are losing ground.
3. Fashion is fragmenting
Fast fashion still performs, but growth is slowing. Shoppers are shifting toward resale platforms and marketplaces that offer affordability and sustainability in one.
4. Grocery is about confidence, not just cost
Spend is still rising across grocery - but discounters, delivery services, and high-end grocers are outpacing traditional supermarkets. Value is no longer just about price; it’s about trust and convenience.
Consumers are still buying. They’re just doing it on their terms. The winners in 2025 will meet them where they are — with relevance, value, and visibility.”
Want the full data?
The full report includes:
- Category-by-category breakdowns from 2022 to 2024
- 2025 retail forecasts across 14 key sectors
- Consumer behaviour insights and shopping intent
- Strategic recommendations for campaign planning
Download the Full Report

UK Loyalty Movement Report: Retail
UK Loyalty Movement Report: Retail
Introduction
In our previous report, Redefining Customer Loyalty, Cardlytics defined loyalty as a consumer’s preference for a merchant over its competitors, analysing spending across six industries to measure customer loyalty and spending patterns with both loyal and non-loyal customers.
But customer behavior isn’t fixed - customers shift between loyalty segments over time. Understanding these shifts helps identify churn and informs strategies to nurture relationships and move customers to higher loyalty segments. In our UK Loyalty Movement Report, we dive into customer behavior in the Retail category to better understand engagement over time by analyzing more than £245 billion in consumer spend behavior.*
Retail Category Loyal Customers
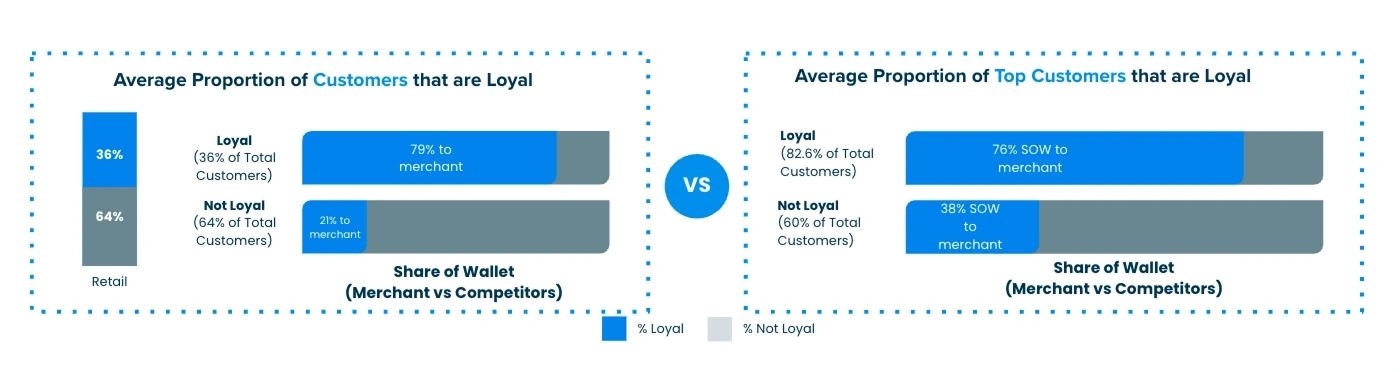
On average, 64% of a merchant’s customers are not actually loyal. But the loyal segment has a much higher share of wallet (79%) than a not loyal segment (21%).
Top Customers (top 20% of most frequent transactors) show a strong uptick as loyal vs not loyal customers. But the loyal customer segment shows more than 3x higher share of wallet.
Findings
We looked into purchase data across Retail in the UK over the last 8 quarters (Q1-23 through Q4-24) on a quarter by quarter basis to see whether even the “most loyal” customers showed changes in their purchase behavior.
Retail Loyalty Movement
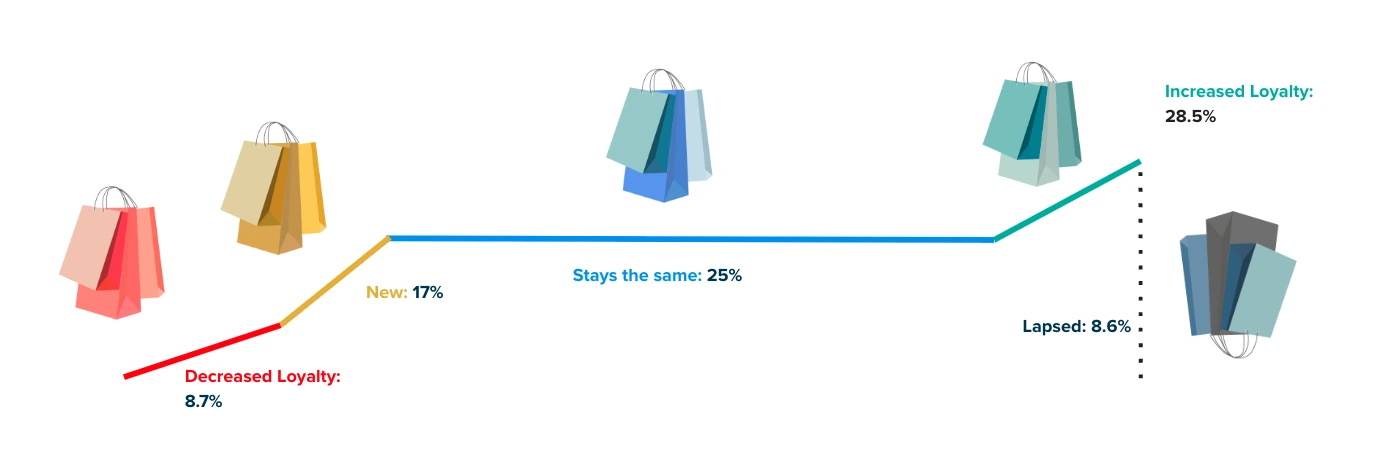
Overall, quarter over quarter, 25% of customers tend to remain in their existing segments while 37.2% increase or decrease their loyalty to a merchant. Yet there is much more extensive customer loyalty movement within the “not loyal” segments.
Segment movement
The Tied segment (part of the Not Loyal group) demonstrates the most volatility — with just 7% remaining stable and 29% moving up and 29% moving down into other segments.
Retail Leaky Bucket
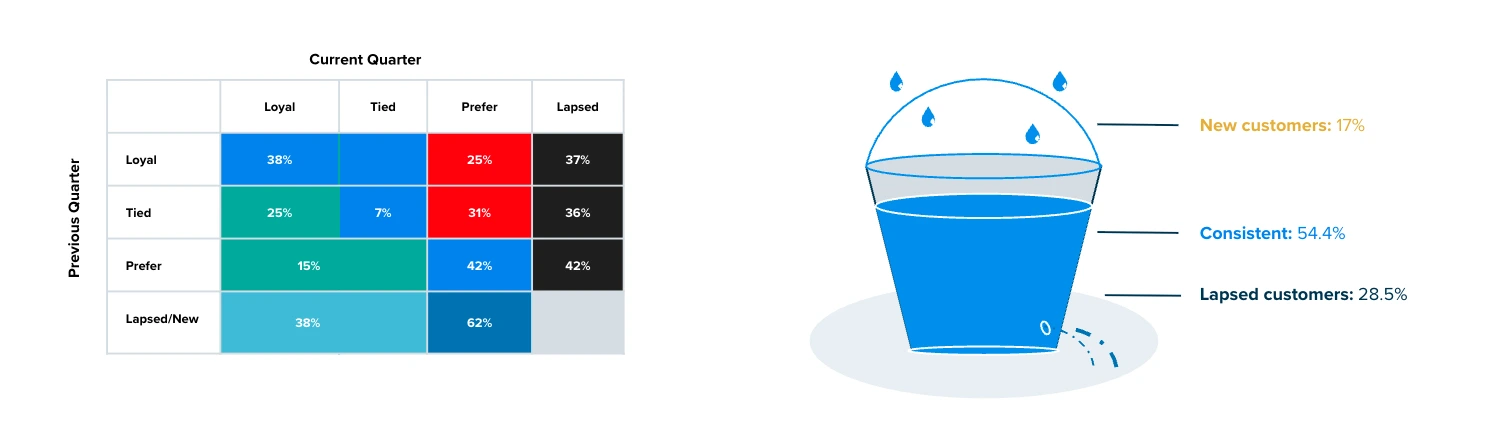
Retail brands are acquiring new customers yet even more existing customers are moving into the lapsed tier. This cycle can be reversed by continuing to nurture existing customers.
Diving deeper into the individual segments tells us:
- Loyal customers and those that Prefer the competition are the most stable segments, with 38% and 42% respectively staying in the same category from one
quarter to the next. This indicates a strong commitment to brand preference — whether for your brand or a competitor's. - Customers in the Tied segment exhibit the highest level of movement, with just 7% remaining Tied quarter-over-quarter. These shoppers are the most susceptible to influence and represent a key opportunity for brands aiming to tip the scales in their favour.
- Interestingly, Loyal customers still show a 25% lapsed rate, which is comparable to the Tied segment’s 36% lapsed rate. This suggests that attrition among Loyal customers may not be driven by brand disengagement, but rather by natural gaps in purchase cycles — for example, customers who buy apparel less frequently.
Definitions of Customer Segments
Loyal Customers:
- Loyal: Only shop with a specific brand, or have the highest share of wallet with a given brand and relative rank is lower than all other brands in consideration set
Not Loyal Customers:
- Tied: Similar relative ranks to 2 or more brands regardless of share of wallet ranking
- Prefer: Lower share of wallet and higher rank than other brands in their consideration set
- Lapsed: Shopped historically but do not shop currently, as defined by the analysis time period
- New: Shop currently but have not shopped historically, as defined by the analysis time period
Takeaways
Marketers know it’s more costly to acquire or re-acquire customers than to keep existing ones engaged. When brands neglect current customers, they risk losing them and undoing past investment yet the reasons why a customer might “lapse” is different depending upon their loyalty tier. Loyalty is fragile and demands ongoing effort as competition is always close by. To stay top of mind, marketers must continuously nurture relationships, understand customer needs, and offer seamless experiences. To foster loyalty with your customers, consider these recommendations:
- Use an “always on” strategy to keep customers engaged, regardless of purchase
frequency. - Regularly update/refine customer segments and adjust reward offers to keep
them engaged. - Use targeted campaigns to boost loyalty and revenue.
Cardlytics can deliver a comprehensive Customer Loyalty Analysis with insights into customer behavior and movement across defined loyalty segments. Contact us for more details.
* For this report, we've selected the entire retail category in our data, collectively representing over £245bn in annual card spend. This sample differs from the previous Customer Loyalty Analysis report.

UK State of Spend Report: Retail
"If the price is right"
New Cardlytics State of Spend study reveals tentative recovery in consumer confidence
After two years of post-pandemic recalibration, UK consumers are shopping again – just not like they used to.
The latest data from Cardlytics reveals a retail landscape defined less by indiscriminate demand and more by considered choice.
While spending remains resilient in many categories, shoppers are now clearly applying more scrutiny to how and where they spend. Value, convenience, and perceived quality are under the microscope, and if expectations aren’t met, consumers are pulling back.
This divergence is playing out differently across the retail sector. Categories like high-street fashion and beauty are holding strong, buoyed by brand loyalty, reviving high streets, and the occasional feel-good purchase.
But grocery and household tell a more precarious story, where price sensitivity and shifting shopping habits are forcing brands to work harder and smarter to keep customers loyal.
Whether shopping in-store, online, or through delivery apps, today’s consumer expects more than just competitive pricing.
They’re looking for value that feels personal. For retailers, the challenge is clear: speak directly to customer priorities, or risk being left behind.
Retail: A resilient core – but rewards go to relevance
Fashion and beauty continue to defy broader economic headwinds. Spending on make-up and beauty products surged by 19% year-on-year in Q1 2024, and growth has carried into 2025, albeit at a more modest 5%. The number of transactions in the sector has outpaced spend, suggesting that while shoppers remain engaged, they are consciously managing budgets – opting for smaller, more frequent purchases that still offer a sense of indulgence. It’s a pattern that reflects the so-called “lipstick effect”: the tendency for consumers to turn to affordable luxuries during uncertain times.

High street fashion is also faring well. After growing 9% in 2024, the category recorded a further 5% uptick in early 2025, driven by established brands with a strong physical presence and a loyal customer base. This comes despite recent cyber attacks on major retailers, which - in good news for the sector - hasn’t deterred shoppers as of yet. Rather than stop spending, it just shifted it - as shoppers showed they are loyal to their habits over individual brands.
Online fast fashion, meanwhile, showed little momentum through 2024, but increased sharply in Q1 2025 with a 13% rise in spend. Discount-led promotions and trend-led buying may be drawing cautious consumers back to basket - but this trend remains nascent stages.
However, not all categories are experiencing this trend. Department stores saw a 4% drop in spend in 2024, with a further 5% decline in 2025. Transactions have followed the same downward trajectory, pointing to a broader shift away from traditional department store formats. As shoppers prioritise experience, value and, crucially, brand alignment, department stores may be losing relevance to more focused propositions.
Cardlytics Analysis
Retailers that combine physical presence with a strong sense of brand identity continue to perform strongly. But brands can no longer rely on habitual customer loyalty. Our data shows clear momentum for brands that are giving customers a feel-good factor to shopping, whether that be through price, experience or personalisation.
Case Studies
- A leading e-commerce & retail brand partnered with CDLX to drive new customers and ensure incremental revenue, by leveraging CDLX’s pay-per-performance channel to incentivise spend from competitors via cash back reward. The campaign delivered £1m revenue across 20K redemptions, captured 27% SoW across redeemers from competitors. Across the “New” segment, CDLX captured 77% SoW from competitors.
- A major European health & wellness brand partnered with CDLX to acquire new customers, re-engage and retain lapsed and existing customers, and drive sales over a six week period in Q1 2025. Leveraging our proprietary transaction data into data-driven marketing, the campaigns drove over £2M Revenue and an average ROAS of £24.41. During that period, the brand increased share of wallet by 52%, crucially gaining ground on key competitors in the health and wellness industry.
Grocery: Essential, but under pressure
Supermarkets remain a staple of consumer spending, but the data tells a story of growing caution. After recording 9% growth in 2024, so-called ‘big grocers’ saw a 3% fall in spend in the first quarter of 2025. The number of transactions have held steady however, suggesting that shoppers are still showing up – they’re just spending less when they do.

This theme appeared prominently across convenience grocery.
Spend rose by 11% in 2024, before dipping 4% this year. Unlike the supermarkets, however, transaction volumes declined modestly, pointing to a broader behavioural shift. Shoppers appear to be planning more carefully, opting for fewer top-up trips and returning to larger, weekly shops.
In contrast, grocery delivery continued to grow, extending its gains from last year. After a 16% rise in 2024, the category saw a further 13% increase in early 2025, with both the average transaction value and number of orders increasing. Once considered a pandemic-era habit, online grocery ordering now looks like a lasting behavioural shift – particularly for customers who value predictability, convenience and the ability to budget in advance.
Cardlytics Analysis
The return of the big weekly shop, combined with the decline in spontaneous convenience visits, signals a shift towards planned, value-driven behaviour. For grocers, this is both a challenge and an opportunity.
The ability to personalise offers, reinforce loyalty, and remove friction at checkout is becoming critical, particularly as shoppers become more deliberate in how and where they spend. Cashback rewards can help bridge the gap between price expectations and perceived value, especially when tailored to individual behaviours. Delivery providers are responding well to this shift, offering consistent, low-surprise experiences that support budgeting and convenience. A similar customer-first approach is increasingly expected in-store, where value and planning now take precedence over impulse.
Case Study
A leading food delivery platform and CDLX partnered to drive new customer acquisition and incremental revenue, using cashback rewards to incentivise spend from competitors.
The campaigns delivered 119K redemptions and £2.9M in revenue, capturing 44% share of wallet across lapsed and acquisition segments. Incremental revenue from the "New" customer segment alone reached £470K, with repeat customers generating an additional £7.2M in spend post-campaign.
Household: Still spending, but pulling back
After a period of steady post-pandemic investment in the home, household spending is beginning to cool. While consumers are still investing in their living spaces, they are doing so with increasing caution – prioritising essential upgrades over discretionary improvements. Across all categories, the number of transactions has remained broadly stable, but average spend is softening – indicating a shift towards smaller, more deliberate purchases.
This was the case for DIY, which saw spend increase modestly by 4% in 2024, before falling 1% in early 2025. Transaction volumes held steady, but average spend edged down – showing that consumers are now focusing on smaller-scale fixes or improvements, rather than large projects.
Value homeware followed a similar pattern, emphasising the importance of affordability in the household goods sector. While total spend softened, the number of transactions held firm, showing a consumer preference for incremental upgrades that deliver a sense of progress without straining budgets. Elsewhere, spending on garden and outdoor products declined in early 2025, reflecting a clear pivot towards core priorities, with seasonal or aspirational purchases falling by the wayside.

Spend for electricals declined by 6% in 2025, alongside a 7% fall in transactions. But average spend rose 6%, suggesting a more selective, quality-focused approach to purchasing habits. Consumers appear to be waiting longer between purchases, but when they do buy, they are choosing higher-spec replacements – reinforcing the idea that perceived value, rather than just price, is driving decision-making.
Cardlytics Analysis
In the household sector, the rules of engagement have changed. Big-ticket spending is cooling, but our data shows that consumers are still willing to invest when they feel the value is tangible, especially on higher-spec replacements in categories like electricals.
Cashback rewards are proving particularly effective in this space, encouraging considered purchases while reinforcing the idea of getting more for less. Retailers focused on affordability are outperforming their lifestyle-led counterparts.
The signal from consumers is clear: value and functionality matter more than non-essential or lifestyle-led propositions. Brands that demonstrate they understand their customers’ priorities - and reinforce that through personalised offers and targeted cashback - will go further in earning loyalty and driving conversion.
Case Study
A leading DIY brand and CDLX partnered to improve incremental sales, drive new customers and repeat visits as well as deepen loyalty with existing customers. Using CDLX’s proprietary purchase intelligence data, the campaigns identified and targeted customers with personalised value-driven offers.
Over the six-week period, over £800k in incremental sales were driven. The brand has seen 39% of campaign customers return to shop again, and captured 60% share of wallet from key competitors during that time.
Navigating a more cautious consumer landscape
Our analysis for the first four months of 2025 painted a clear picture of an increasingly value-conscious consumer. While there were bright spots — such as sustained demand for affordable luxuries and resilient online grocery growth — the broader retail environment showed signs of growing caution. The data indicated that a softening in consumer confidence could be on the horizon — something that recent retail sales figures from May have now confirmed, with sharp drops in sales linked to rising inflation and consumer cutbacks.
The opportunity for brands lies in how they respond. Our data shows that personalisation, value-driven propositions, and transparent rewards are more important than ever. Shoppers are still spending, but they are making deliberate choices about where they see true value. Cashback rewards and tailored offers can play a crucial role in reinforcing loyalty and driving conversion during this period of increased scrutiny.
For retailers, the message is clear: relevance, value, and trust must be at the heart of every interaction. Businesses that consistently prove they can deliver meaningful value at the right price will be best positioned to secure customer loyalty and drive sustainable growth in the uncertain months ahead.

UK Loyalty Movement Report: Airline
Airlines: Unpacking the State of Customer Loyalty
Introduction
Previously, Cardlytics defined loyalty as a consumer’s preference for a merchant over its competitors.* We analyzed billions in spending across six industries to measure customer loyalty and spending patterns with both loyal and non-loyal customers.
But customer behavior isn’t fixed—customers shift between loyalty segments over time. Understanding these shifts helps identify churn and informs strategies to nurture relationships and move customers to higher loyalty segments. In our Loyalty Movement Report, we dive into the Airline category to better understand engagement over time by analyzing more than £40B in consumer spend behavior.
.png)
Findings:
We looked into purchase data at all Airlines in the UK over the last 8 quarters (Q1-23 through Q4-24) on a quarter by quarter basis to see whether even the “most loyal” customers showed changes in their purchase behavior.

Segment Movement
.png)
Of the portion of each customer segment that is non-lapsed, those that are loyal to a specific airline show the strongest brand retention - 31% remain loyal quarter over quarter. In contrast, Tied and Prefer customers demonstrate greater variability in behaviour, with only 4% and 12% respectively maintaining their previous preference.
Loyal customers tend to remain consistent in their airline choice, likely driven by the strength of airline loyalty programmes and exclusive incentives. However, Tied and Prefer customers show clear signs of behaviour fluidity, highlighting a key opportunity for targeted campaigns to drive conversion toward brand loyalty.
Lapsed behaviour is high across all segments—65% of previously loyal customers lapsed, and similar rates are observed among Tied (63%) and Prefer (67%) segments. This reflects typical airline purchasing patterns, where customer loyalty can be disrupted by pricing, availability, or external factors, regardless of prior loyalty classification.
Airlines Leaky Bucket
Airlines are acquiring new customers yet even more existing customers are moving into the lapsed tier. This cycle is expected based on typical consumer behavior for airline travel quarter over quarter but reinforces need to nurture existing relationships.
.png)
Takeaways:
Airline marketers’ inherent focus on nurturing loyal customers is well-know and consumer spend data show it’s working - Loyal customers tend to stay loyal. But huge opportunity exists with customers who are not loyal to any specific airline and could be lured through greater incentives. To stay top of mind, marketers must continuously nurture relationships, understand customer needs, and offer seamless experiences. To foster loyalty with your customers, consider these recommendations:
- Use an “always on” strategy to keep customers engaged, regardless of purchase frequency.
- Regularly update/refine customer segments and adjust reward offers to keep them engaged.
- Use targeted campaigns to boost loyalty and revenue.
Cardlytics can deliver a comprehensive Customer Loyalty Analysis with insights into customer behavior and movement across defined loyalty segments. Contact us for more details.

Loyalty Movement Report: Apparel
Apparel: Stop Taking Customer Loyalty for Granted
Introduction
In our previous report, Redefining Customer Loyalty, Cardlytics defined loyalty as a consumer’s preference for a merchant over its competitors. We analyzed $160B in spending across six industries to measure customer loyalty and spending patterns with both loyal and non-loyal customers.
But customer behavior isn’t fixed—customers shift between loyalty segments over time. Understanding these shifts helps identify churn and informs strategies to nurture relationships and move customers to higher loyalty segments. In our Loyalty Movement Report, we dive into customer behavior in the Apparel category to better understand engagement over time by analyzing more than $17B in consumer spend behavior.*
Apparel Category Loyal Customers
On average, 61% of a merchant’s customers are not actually loyal. But the loyal segment has a much higher share of wallet (85%) than a not loyal segment (21%).
.png)
Top Customers (top 10% of most frequent transactors) show a +6 point uptick as loyal vs not loyal customers. But the loyal customer segment shows more than 3x higher share of wallet.
Findings
We looked into purchase data at all Apparel brands in the US over the last 8 quarters (Q1-23 through Q4-24) on a quarter by quarter basis to see whether even the “most loyal” customers showed changes in their purchase behavior.
Apparel Loyalty Movement
Overall, quarter over quarter, 41% of customers tend to remain in their existing segments while 16% increase or decrease their loyalty to a merchant. Yet there is much more extensive customer loyalty movement within the “not loyal” segments.
.png)
Segment Movement
While all segments show purchase behavior movement, the Tied segment (part of Not Loyal customers) shows the most movement - both up (29%) and down (29%) - into other segments.
.png)
Apparel Leaky Bucket
Apparel brands are acquiring new customers yet even more existing customers are moving into the lapsed tier. This cycle can be reversed by continuing to nurture existing customers.
.png)
Diving deeper into the individual segments tells us:
- Loyal customers and those that Prefer the competition are the most rigid (with 57% and 58% staying the same, respectively). Those customers that are Tied have the greatest propensity for a behavior change (with only 18% staying the same).
- While the most Loyal customers show a 25% lapsed rate at similar levels as Tied, this is most likely not connected to churn vs connected to cadence of shopping behavior (maybe they don’t buy clothes every that frequently).
Definitions of Customer Segments
Loyal Customers
Loyal: Only shop with a specific brand, or have the highest share of wallet with a given brand and relative rank is lower than all other brands in consideration set
Not Loyal Customers
Tied: Similar relative ranks to 2 or more brands regardless of share of wallet ranking
Prefer: Lower share of wallet and higher rank than other brands in their consideration set
Lapsed: Shopped historically but do not shop currently, as defined by the analysis time period
New: Shop currently but have not shopped historically, as defined by the analysis time period
Takeaways
Marketers know it’s more costly to acquire or re-acquire customers than to keep existing ones engaged. When brands neglect current customers, they risk losing them and undoing past investment yet the reasons why a customer might “lapse” is different depending upon their loyalty tier. Loyalty is fragile and demands ongoing effort as competition is always close by. To stay top of mind, marketers must continuously nurture relationships, understand customer needs, and offer seamless experiences. To foster loyalty with your customers, consider these recommendations:
- Use an “always on” strategy to keep customers engaged, regardless of purchase frequency.
- Regularly update/refine customer segments and adjust reward offers to keep them engaged.
- Use targeted campaigns to boost loyalty and revenue.
Cardlytics can deliver a comprehensive Customer Loyalty Analysis with insights into customer behavior and movement across defined loyalty segments. Contact us for more details.
* For this report, we've selected the entire Apparel category in our data, collectively representing $17bn in annual card spend. This sample differs from the previous Customer Loyalty Analysis report.
About Cardlytics
Cardlytics (NASDAQ: CDLX) is a commerce media platform, powered by our publishers’ first-party purchase data, that makes commerce smarter and more rewarding for everyone. We offer a range of solutions to help advertisers and publishers, including financial institutions, grow and strengthen customer loyalty. With visibility into approximately half of all card-based transactions in the U.S. and a quarter in the U.K., Cardlytics enables advertisers to engage consumers at scale and drive incremental sales through our industry-leading financial media network. Publisher partners can enhance their platforms with relevant and personalized offers that improve the shopping experience for their customers. Cardlytics also offers identity resolution capabilities through Bridg, which helps convert anonymous shoppers into known and reachable customers. Headquartered in Atlanta, Cardlytics has offices in Menlo Park, Los Angeles, Champaign, New York and London. Learn more at www.cardlytics.com or follow us on LinkedIn.

Driving Customer Acquisition & Loyalty with Card-Linked Offers (CLOs)
In the ever-evolving landscape of advertising, brands are constantly seeking innovative and effective ways to connect with new customers and drive sales. One increasingly powerful tool gaining significant traction is the card-linked offer (CLO). This unique approach to customer acquisition leverages real-time purchase data to deliver targeted offers directly to consumers through their payment cards, creating a seamless and impactful experience.
CLOs are rapidly becoming a key driver for both online and in-store transactions. Their effectiveness stems from the ability to tap into actual consumer spending habits, providing advertisers with a level of precision and insight often unmatched by traditional channels. By analyzing past customer purchase behavior, brands can identify and target high-value, in-market audiences with relevant offers, fostering a higher likelihood of conversion and repeat business.
What Makes CLOs a Game-Changer?
Compared to conventional performance marketing tactics, CLOs offer several distinct advantages:
- Data-Driven Precision: CLOs provide access to rich, deterministic purchase data, eliminating the reliance on probabilistic estimations. This allows for highly accurate targeting of specific consumer segments based on their actual spending patterns.
- Measurable Incrementality: One of the most compelling benefits of CLOs is the ability to accurately measure the incremental impact of marketing campaigns. By establishing clear test and control groups based on historical purchase data, advertisers can gain a true understanding of the uplift generated by their offers.
- Fraud-Free and Brand-Safe Environment: Operating within the secure infrastructure of financial institutions, CLOs offer a 100% bot and fraud-free environment, ensuring that advertising spend reaches genuine consumers.
- Omnichannel Reach: CLOs are effective in driving both online and in-store sales, providing a unified approach to reaching consumers regardless of their preferred shopping method. This omnichannel capability is crucial in today's interconnected marketplace.
The Evolution of CLOs: Trends Shaping the Future
The landscape of card-linked offers is continuously evolving, driven by advancements in technology and a deeper understanding of consumer behavior. Key trends shaping the future of CLOs include:
- Enhanced Personalization: Leveraging the power of machine learning, CLOs are becoming increasingly sophisticated in delivering hyper-personalized offers tailored to individual consumer preferences and predicted future needs.
- Deeper Data Integration: The integration of CLO platforms with CRM systems and data connectivity partners enables advertisers to layer their own first-party data with transaction insights, leading to even more refined targeting and a holistic view of their customers.
- Expansion into New Verticals: While traditionally strong in sectors like dining, retail, and travel, CLOs are expanding their reach into new and unexpected industries like the auto industry, demonstrating their versatility and broad applicability.
Building Brand Loyalty Beyond the Transaction
The power of CLOs extends beyond simply driving a single purchase. By strategically utilizing targeted offers and understanding customer behavior, brands can foster long-term loyalty. CLOs enable businesses to re-engage lapsed customers, incentivize repeat purchases, and cultivate stronger relationships with their most valuable consumers.
Cardlytics and Qualtrics recently partnered to survey shoppers and evaluate the perspective of customers who leverage card-linked offers. Unsurprisingly, the survey found that CLOs create a more rewarding experience for shoppers and can act as that critical tipping point to influence purchase decisions.
In fact, the data shows customers spend more with card-linked offers in-hand:
- 60% of customers engage more with card-linked offers when their finances are tight
- 64% agree that having card-linked offers encourages them to spend more per transaction
- 72% of customers are more likely to spend with a brand that offers card-linked rewards
Integrating CLOs Into Your Advertising Strategy
While CLOs offer significant potential, advertisers must understand how they fit into their broader strategy. As the lines between traditional affiliate marketing and CLOs become increasingly blurred through greater network integration, a unified approach is emerging. However, it's crucial to recognize the unique attribution models associated with CLOs, which often focus on overall incremental lift rather than last-click attribution.
Navigating the CLO Landscape: Key Considerations
For brands considering implementing a CLO program, several factors are crucial for success:
- Understanding the Nuances: It's vital to recognize how CLOs differ from traditional affiliate marketing and understand their specific capabilities and limitations.
- Strategic Budgeting: Carefully consider the pricing models associated with CLOs, whether it's a cost-per-acquisition model or funding the offer directly.
- Focusing on Incrementality: Shift the focus from simple return on ad spend to measuring the true incremental return generated by CLO campaigns.
- Leveraging Data Wisely: Tap into the rich data insights provided by CLO partners to refine targeting, personalize offers, and understand customer behavior.
- Embracing Testing: Like any effective advertising channel, experimentation is key to unlocking the full potential of CLOs.
The Future Is Linked
Card-linked offers represent a powerful evolution in customer acquisition and engagement. By harnessing the wealth of purchase data available, brands can connect with consumers in a more relevant, personalized, and measurable way.
Cardlytics is not only a leading commerce media platform, but we are also the pioneer in card-linked offers. Through our partnerships with top financial institutions, we have visibility into approximately $5.8T in annual consumer spend, allowing us an unrivaled view of consumer spending. Our platform helps you reach real customers at the right time when they are thinking about how and where to spend their money. With targeting based on past purchase history, our offers provide real value to consumers and act as the critical tipping point for a purchase.
As technology advances and the integration of CLOs within the broader marketing ecosystem deepens, this innovative approach is poised to play an increasingly vital role in driving business growth and fostering lasting customer relationships. Get started with Cardlytics today to see how CLOs can help your brand acquire customers and strengthen customer loyalty in today’s economic climate: https://www.cardlytics.com/marketing-solutions
About Cardlytics
Cardlytics (NASDAQ: CDLX) is a commerce media platform, powered by our publishers’ first-party purchase data, that makes commerce smarter and more rewarding for everyone. We offer a range of solutions to help advertisers and publishers, including financial institutions, grow and strengthen customer loyalty. With visibility into approximately half of all card-based transactions in the U.S. and a quarter in the U.K., Cardlytics enables advertisers to engage consumers at scale and drive incremental sales through our industry-leading financial media network. Publisher partners can enhance their platforms with relevant and personalized offers that improve the shopping experience for their customers. Cardlytics also offers identity resolution capabilities through Bridg, which helps convert anonymous shoppers into known and reachable customers. Headquartered in Atlanta, Cardlytics has offices in Menlo Park, Los Angeles, Champaign, New York and London. Learn more at www.cardlytics.com or follow us on LinkedIn.
Loyalty Movement Report: Airlines
Airlines: Unpacking the State of Customer Loyalty
Introduction
In our previous report, Redefining Customer Loyalty, Cardlytics defined loyalty as a consumer’s preference for a merchant over its competitors. We analyzed $160B in spending across six industries to measure customer loyalty and spending patterns with both loyal and non-loyal customers.
But customer behavior isn’t fixed—customers shift between loyalty segments over time. Understanding these shifts helps identify churn and informs strategies to nurture relationships and move customers to higher loyalty segments. In our Loyalty Movement Report, we dive into the Airline category to better understand engagement over time by the entire more than $58B in consumer spend behavior.*
Airline Category Loyal Customers
On average, 39% of a merchant’s customers are not loyal. Yet the loyal segment shows extreme loyalty when it comes to share of wallet (95%) where as a not loyal segment does not (28%).

Top Customers (top 10% of most frequent transactors) are heavily loyal - 2/3. And that loyal customer segment shows the same extreme loyalty in terms of share of wallet as all customers.
Findings
We looked into purchase data at all Airlines in the US over the last 8 quarters (Q1-23 through Q4-24) on a quarter by quarter basis to see whether even the “most loyal” customers showed changes in their purchase behavior.
Airline Loyalty Movement
Overall, quarter over quarter, customers tend to stay in their same segment (36%) while there is an equal amount that increase/decrease loyalty (7%) and are either new or lapsed (22% and 26%, respectively). However, when digging into the individual segments, the opportunity becomes more clear among segments that are categorized as non-loyal.
.png)
Segment Movement
Of the ⅔ of each customer segment that is non-lapsed, those that are loyal to a specific airline tend to stay loyal (57%). However, those categorized as “non-loyal” (Tied/Prefer) show significant willingness to to shop around (43% and 46%, respectively).
.png)
Airline Leaky Bucket
Airlines are acquiring new customers yet even more existing customers are moving into the lapsed tier. This cycle is expected based on typical consumer behavior for airline travel quarter over quarter but reinforces need to nurture existing relationships .
.png)
Diving deeper into the individual segments tells us:
- Loyal customers typically do not switch airlines, which is most likely due to airlines robust loyalty programs and incentives. However, customers that are Tied or Prefer have a high propensity for behavior change and show an opportunity for targeted campaigns to influence their behavior.
- Lapsed customers are similar across all segments, which is reflective of typical airline purchasing behavior - regardless of their loyalty categorization.
Definitions of Customer Segments
Loyal Customers
Loyal: Only shop with a specific brand, or have the highest share of wallet with a given brand and relative rank is lower than all other brands in consideration set
Not Loyal Customers
Tied: Similar relative ranks to 2 or more brands regardless of share of wallet ranking
Prefer: Lower share of wallet and higher rank than other brands in their consideration set
Lapsed: Shopped historically but do not shop currently, as defined by the analysis time period
New: Shop currently but have not shopped historically, as defined by the analysis time period
Takeaways
Airline marketers’ inherent focus on nurturing loyal customers is well-know and consumer spend data show it’s working - Loyal customers tend to stay loyal. But huge opportunity exists with customers who are not loyal to any specific airline and could be lured through greater incentives. To stay top of mind, marketers must continuously nurture relationships, understand customer needs, and offer seamless experiences. To foster loyalty with your customers, consider these recommendations:
- Use an “always on” strategy to keep customers engaged, regardless of purchase frequency.
- Regularly update/refine customer segments and adjust reward offers to keep them engaged.
- Use targeted campaigns to boost loyalty and revenue.
Cardlytics can deliver a comprehensive Customer Loyalty Analysis with insights into customer behavior and movement across defined loyalty segments. Contact us for more details.
* For this report, we've selected the entire Airlines category in our data, collectively representing$58bn in annual card spend. This sample differs from the previous Customer Loyalty Analysis report.
About Cardlytics
Cardlytics (NASDAQ: CDLX) is a commerce media platform, powered by our publishers’ first-party purchase data, that makes commerce smarter and more rewarding for everyone. We offer a range of solutions to help advertisers and publishers, including financial institutions, grow and strengthen customer loyalty. With visibility into approximately half of all card-based transactions in the U.S. and a quarter in the U.K., Cardlytics enables advertisers to engage consumers at scale and drive incremental sales through our industry-leading financial media network. Publisher partners can enhance their platforms with relevant and personalized offers that improve the shopping experience for their customers. Cardlytics also offers identity resolution capabilities through Bridg, which helps convert anonymous shoppers into known and reachable customers. Headquartered in Atlanta, Cardlytics has offices in Menlo Park, Los Angeles, Champaign, New York and London. Learn more at www.cardlytics.com or follow us on LinkedIn.

UK Loyalty Movement Report: QSR
Introduction
In our previous report, Redefining Customer Loyalty, Cardlytics defined loyalty as a consumer’s preference for a merchant over its competitors. We analyzed billions in spending across six industries to measure customer loyalty and spending patterns with both loyal and non-loyal customers.
But customer behavior isn’t fixed—customers shift between loyalty segments over time. Understanding these shifts helps identify churn and informs strategies to nurture relationships and move customers to higher loyalty segments. In this Report, we dive into customer behavior in the QSR category to better understand engagement over time by analyzing more than £5.8bn in consumer spend behavior.*

Findings: loyalty is fluid, not fixed
We looked into purchase data at all QSRs in the UK over the last 8 quarters (Q1-23 through Q4-24) on a quarter by quarter basis to see whether even the “most loyal” customers showed changes in their purchase behavior.
QSR Loyalty Movement
Overall, quarter over quarter, 36% of customers tend to remain in their existing segments and 26% increase or decrease their loyalty to a merchant, showing that QSR customers tend to be more promiscuous than other industries. Also, there is much more extensive customer loyalty movement within the “not loyal” segments.

Findings: segment movement
Diving deeper into the individual segments tells us:
- Loyal customers are the most stable, with 58% staying Loyal.
- Prefer customers also show strong retention — 52% remain in that segment.
- Tied customers are the most fluid — only 10% stay Tied, while 58% shift into Loyal or Prefer.
- Churn risk is highest for Prefer customers, with 35% lapsing — nearly 2x higher than Loyal customers (20%).
Segment movement
Customer movement is happening across all segments, but the Tied group shows the highest churn – only 10% remain Tied, while a combined 58% shift into either Loyal (32%) or Prefer (26%). This volatility signals an opportunity to convert mid-loyalty shoppers with targeted interventions.

QSR Leaky Bucket
QSR brands are losing customers faster than they are acquiring them – with Lapsed customers (22.3%) outpacing New customers (15.9%). This signals a need to strengthen retention strategies to prevent long-term erosion of customer loyalty.

Takeaways: It’s more costly to acquire or re-acquire customers than to keep existing ones engaged.
Our analysis shows that 22% of QSR customers have lapsed, outpacing the 15.9% of new customers being acquired. Brands are at risk of net customer loss unless they prioritise loyalty-building efforts.
Our segment movement data also reveals that “Tied” customers are the most fluid, with 90% shifting into other behaviours — with both gains and losses. In contrast, Loyal customers remain relatively stable, and Prefer customers show moderate retention.
To protect and grow market share, marketers must go beyond acquisition. Nurturing relationships and strengthening loyalty can have a direct impact on retention and revenue.
To foster loyalty, consider these recommendations:
- Deploy an “always-on” strategy to stay connected with customers, regardless of purchase frequency.
- Continuously refine customer segments and tailor reward structures to reflect shifting behaviours.
- Launch targeted campaigns focused on converting fluid segments (like Tied and Prefer) into Loyal customers.
Get our insights delivered to you
Stay up to date. Subscribe now.
